

Medical Assistance in Dying in Canada: What the 76,475 Number Isn’t Telling You

Somebody is counting on you not doing the math.
The number 76,475 is everywhere right now. It’s in viral videos, thumbnails, and breathless posts claiming Canada runs a “death conveyor belt.” It gets presented as proof that medical assistance in dying in Canada has spiralled out of control. It’s a real number. It comes from real government data. And the way it’s being used is one of the most calculated pieces of statistical misdirection in Canadian public life today.
Here’s the problem with that. The people pushing 76,475 are betting you won’t ask the one question that takes their whole framing apart: 76,475 over what period of time?
A death toll with no timeframe attached isn’t a statistic. It’s a weapon.
The Number That’s Designed to Shock You
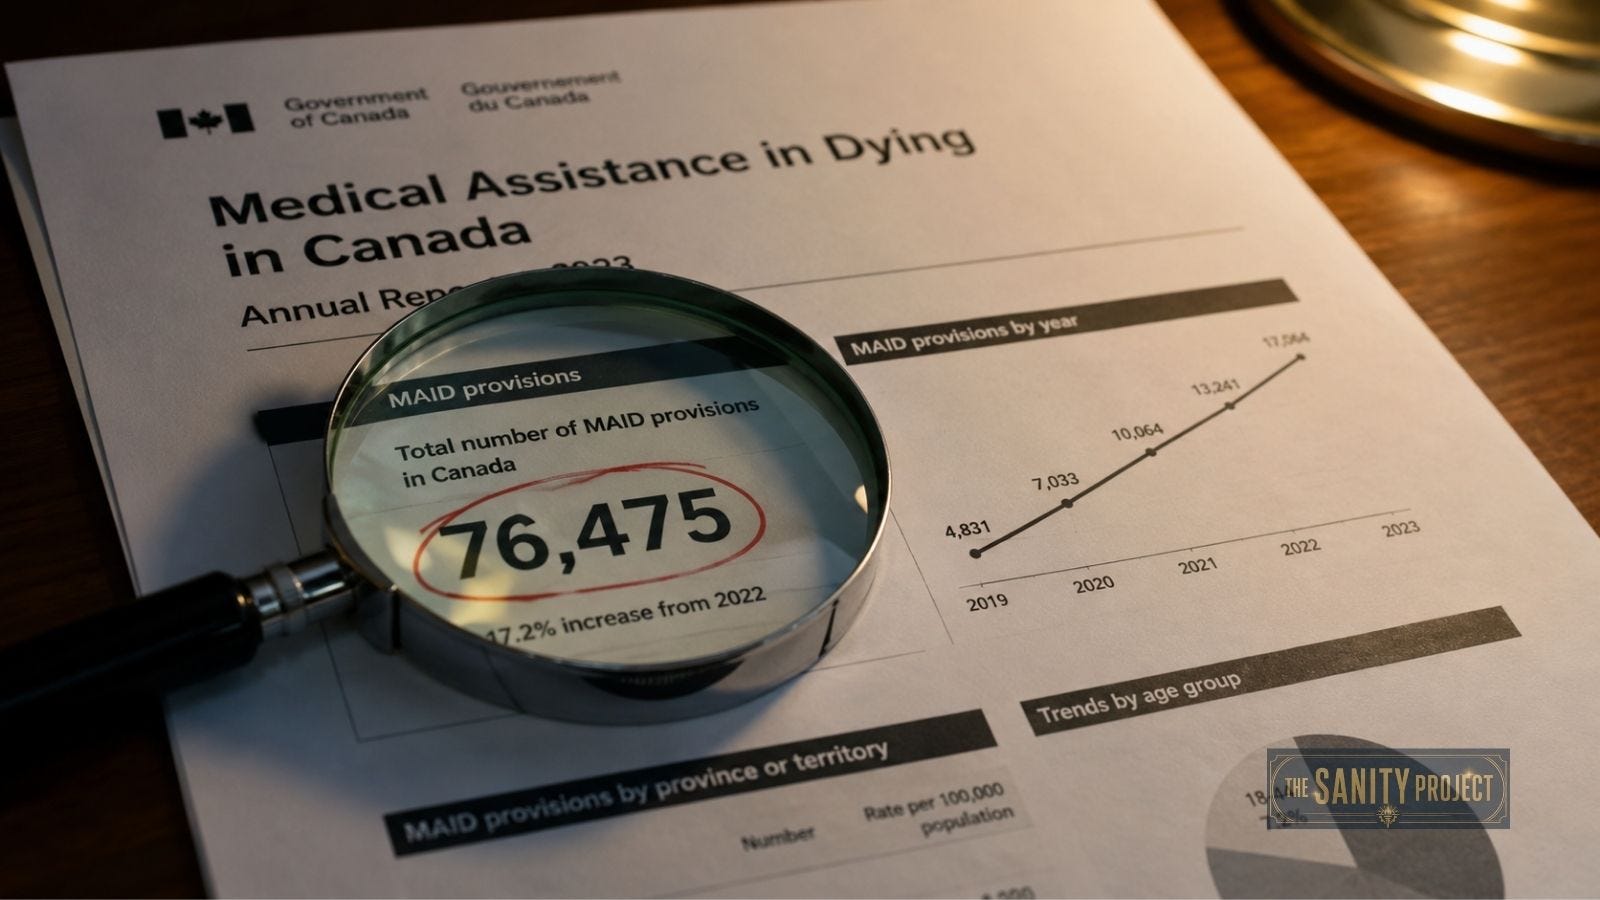
The 76,475 figure is the MAID cumulative total: every provision since the practice became legal in June 2016. Nine years of data, squeezed into one number and presented as if it described last Tuesday.
That’s the arithmetic equivalent of announcing Canadians have eaten four billion meals and demanding to know why nobody’s talking about the obesity emergency. Cumulative totals always grow. They can’t do anything else. Every year, MAID in Canada stays legal; that number gets bigger, even in a year when annual MAID deaths in Canada actually fell.
And that’s exactly why the framing works. A nine-year total sounds like an annual catastrophe to anyone who isn’t told it’s a nine-year total. You’ll notice the viral posts never say “since 2016.” Four words would deflate the whole production, so the four words stay out.
Is the number accurate? Yes. Is it honest? Let’s talk facts.
Starting an online business?
Canadian businesses deserve Canadian hosting. If you’re building a website or blog, this is where I’d start: Web Hosting Canada

What Health Canada’s 2024 Data Actually Shows
The Sixth Annual Report on MAID, Health Canada's annual report covering 2024, is the largest and most transparent dataset on assisted dying in the world. No other country publishes anything close. According to Health Canada’s Sixth Annual Report, here’s what 2024 actually looked like.
2024 MAID by the Numbers
16,499: MAID provisions in 2024, the actual annual figure
326,779: total deaths in Canada in 2024
5.1%: MAID as a share of all Canadian deaths
6.9%: year-over-year growth, down from 36.8% in earlier years
78: median age of recipients
63.6%: share of cases where cancer was the underlying condition
Read that list again. The typical person receiving MAID in Canada is 78 years old and dying of cancer. Nearly three-quarters were already in palliative care. We’re not talking about the young, the poor, or the abandoned. We’re talking about elderly Canadians at the end of life, making a choice that the law was written, on purpose, to give them.
The real 2024 story isn’t explosive growth. It’s a system slowing down on its own.
The MAID growth rate has collapsed from 36.8% to 6.9%. That’s what a policy finding its natural level looks like. The population of people who meet the MAID eligibility criteria, who want this option, and who qualify under a grievous and irremediable medical condition is finite. The two-track design reflects this: track one for people whose natural death is reasonably foreseeable, track two, with stricter MAID safeguards and a 90-day assessment period, for people whose death is not. In 2024, track two made up just 4.4% of provisions. And the safeguards written into Criminal Code Section 241.2 turned away more than 1,300 applicants last year. Conveyor belts don’t have rejection rates.
The Arithmetic of Cumulative Fear
Why does the cumulative framing work so well? Because most people, reasonably, assume that when somebody quotes a death toll, they’re describing a rate.

So let’s do what the viral posts won’t. Divide 76,475 by nine years, and you get an average that sits below the current annual figure, because the program grew from a small base. Compare 16,499 against the total of 326,779 deaths, and you get 5.1%. One in twenty. Significant? Absolutely. A runaway crisis? The assisted dying statistics say otherwise, and they’ve been saying it for six straight annual reports.
But here’s the real kicker: the same Health Canada report that produced the scary number contains every figure you need to debunk the scary framing. The people circulating 76,475 read that report. They found the cumulative total, skipped the annual rate, skipped the slowing growth, skipped the median age, and built a narrative out of the one number that sounds apocalyptic once you strip the context off it.
When somebody hands you a death toll without a denominator, they’re not informing you. They’re recruiting you.
That’s marketing, not fact-finding. And what does it tell you about an argument when it only works if the audience never sees the rest of the page?
Medical Assistance in Dying in Canada vs. the Netherlands After 24 Years
If the slippery slope theory were true, the Netherlands would be the proof. Euthanasia has been legal there since 2002. More than two decades of data, the longest track record on earth.
So what happened? The Netherlands euthanasia rate climbed gradually, then settled at roughly 4 to 5% of all deaths. No explosion. No runaway expansion. A ceiling, reached and held, for nearly a quarter century. If assisted dying in Canada were the uncontrolled outlier its critics describe, this is where the divergence would show up. It doesn’t.

Canada’s 2024 rate is 5.1%, almost exactly where the Dutch system settled, and Canada is arriving at that plateau on a near-identical curve, with euthanasia in Canada decelerating right on schedule. Two different countries, two different health systems, two different legal frameworks, landing on the same number. That’s what happens when a policy serves a stable, finite population: people facing the end of life who value autonomy over duration.
The critics who quote Dutch psychiatrists as a “warning” never quote the Dutch data. There’s a reason for that. The warning only frightens people who haven’t seen the numbers, and the numbers have been public for twenty years.
Twenty-four years of Dutch evidence shows a plateau, not a slope, slippery or otherwise.
Looking to grow your YouTube channel?
One of my favourite tools is vidIQ. It helps take the mystery out of YouTube growth by providing keyword research, channel audits, AI-powered content ideas, and competitor insights.

Why This Framing Exists, and Who Benefits
The 76,475 narrative didn’t grow on its own. It feeds specific audiences and specific agendas.
For engagement-driven media, fear of a “death system” outperforms a story about elderly cancer patients making considered choices about end-of-life care in Canada. For opponents of the right to die in Canada, many of whom fought the law on principle long before any data existed, the cumulative total is a gift: a number that grows forever and never needs context. For the wider misinformation economy, MAID statistics 2024 are just raw material, the same way crime numbers and vaccine numbers are.
Meanwhile, the public is somewhere else entirely. Polling conducted for Dying With Dignity Canada shows strong majority support for assisted dying in Canada, and that support has held steady for years. The Death with Dignity Canada movement didn’t manufacture the consensus. Decades of Canadians watching people they love suffer did that.
Are there legitimate debates? Yes. Access to palliative care in Canada needs real investment. The delayed expansion covering MAID for mental illness as a sole condition, which remains excluded by law no matter what YouTube tells you, deserves hard scrutiny, as the federal government’s own background materials acknowledge. Data gaps around income and Indigenous identity should be closed. Those conversations matter. The 76,475 panic is drowning them out.
The cost of the fake debate is that we never get to have the real one.

The Verdict
Medical assistance in dying in Canada is one of the most heavily monitored, thoroughly documented end-of-life systems in the world, and the data shows a program working as designed. The annual figure is 16,499, not 76,475. The share of deaths is 5.1%, right in line with the Netherlands after 24 years. Growth is at 6.9% and falling. The median recipient is a 78-year-old cancer patient who was already receiving palliative care.
The viral number is real. The story wrapped around it isn’t. And anyone who quotes a nine-year cumulative total as an annual rate has already told you how much they trust you with the full picture.
Reason beats rage. Facts beat fear. Follow for more fact checks that cut through the noise. Go to thesanity.org.
Listen to the Sanity Project Podcast

Thank you for the post brother. I worked as a sitter for five years 7500 hours not to brag for minimum wage. It was a humbling and sacred time and I worked with many palliative care patients. I sat with the dying while family members were sitting in the lounge. I’m not saying this to judge people, but suffering is real and I witnessed people waiting for months to pass while the spouse made the journey up to the hospital almost daily. So my point of this is until you sat 100 hours with the suffering and the dying my recommendations is you have if you have nothing nice to say don’t say anything amen Namaste
Great essay.
It is a trenchant rebuttal to Urback's horrible anti-MAiD opinion piece in the Globe and Mail this weekend.
Thank you.