


Why Everything Is So Expensive in Canada Despite GDP Growth
Canada’s growth figures are encouraging, while our budgets remain tight. Here’s how to make sense of both.
We open with an encouraging economic headline, then open the grocery bill. The country seems to be making progress. Our bank account seems less convinced.
That frustration deserves a proper explanation. We should be able to recognise economic gains and ask why they have not brought much breathing room to our household. Both reactions can be reasonable.
Our August economy report raised this question. Now let’s look more closely at what the headlines measure, what they miss, and how to judge whether growth is reaching our own lives.
What grew, exactly?
Gross domestic product, or GDP, measures the value of goods and services produced in an economy. “Real” GDP adjusts for price changes, so a larger dollar total caused solely by higher prices does not reflect more production.
In the second quarter of 2026, Canada’s real GDP rose 0.8% from the previous quarter. Real GDP per person rose 1.0%, partly because the population declined. These are quarterly changes, not yearly growth rates.
That is meaningful progress. It also rules out a convenient explanation for this particular quarter: we cannot say all the growth disappeared once population was taken into account. Output per person improved too.
But GDP per person is an average amount of production, not a payment deposited into each person’s account. It does not tell us whose wages rose, who found work, or whose housing bill swallowed the extra income.
The details of production matter. As our May GDP breakdown explored, different industries contribute to the national result. A stronger export business can benefit its workers and suppliers before households elsewhere notice much change.
Nor does one good quarter mean growth keeps arriving evenly. The latest monthly GDP release, published September 29, reported that July output was essentially unchanged. Progress can arrive in uneven steps.
More dollars can still buy less
When we ask whether we are better off, the size of our paycheque is only the beginning. We also need to know what it buys.
Statistics Canada’s August Labour Force Survey reported that average hourly employee wages rose 2.0% from a year earlier. Over the same August-to-August period, consumer prices rose 3.0%.
Adjusting that wage increase for inflation leaves average hourly pay buying about 1% less against the national basket. That is our calculation using the rounded published rates: divide 1.02 by 1.03, then subtract one.
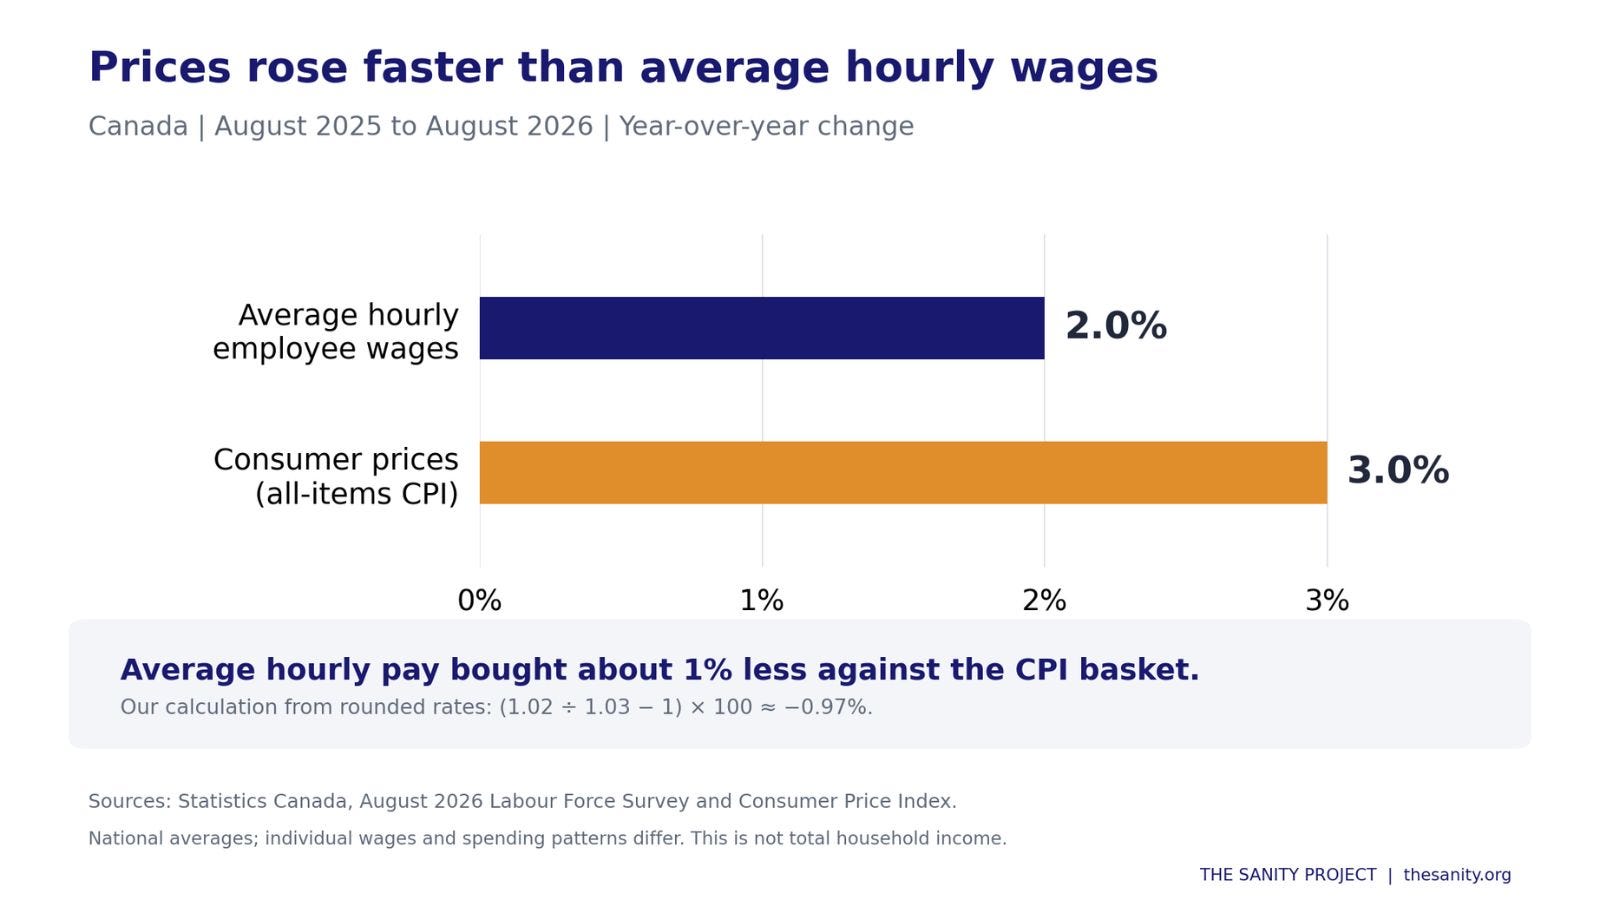
This is an average, not a finding that every worker received the same real pay cut. The mix of employees can change, and an individual raise can be larger or smaller. The national price basket also differs from our own spending.
The same wage release reported just 1.1% growth for employees in the lowest hourly wage quartile. That makes the affordability question especially pressing for workers with little room to absorb higher costs.
Hourly pay still does not describe a whole household. Our position also depends on hours worked, another earner’s employment, taxes, benefits and other income. A respectable hourly raise can coexist with a smaller monthly paycheque if shifts disappear.
That is why we should ask about purchasing power and reliable income, rather than stopping at the announcement of a wage increase. The useful question is whether our income stretches further across the bills we actually pay.
Why is everything still so expensive in Canada?
Part of the answer is that inflation measures how quickly prices change. It does not tell us that earlier increases have been reversed.
If a bill rises from $100 to $120, then increases more slowly to $123, the slower increase helps. We still need $23 more than we did at the starting point. Getting back to $100 would require prices to fall.
The grocery figures make this concrete. Statistics Canada reported that store-bought food prices were 2.8% higher in August than a year earlier, and 29.0% higher than in August 2021.

Picture an indexed grocery basket costing $100 five years ago and $129 now. That illustrates the reported increase; it is not a prediction for every family’s cart. Substitutions, discounts, and different purchases change how much each household spends.
For relief, our income needs to catch up, some costs need to fall, or both. A smaller new price increase helps that process. It does not erase the accumulated gap we are still trying to close.
The latest overall inflation rate was 3.0%, unchanged from July. So even the description “inflation is falling” needs a date and a specific measure. A reassuring phrase can conceal very different developments across the things we buy.
When Does Growth Reach the Kitchen Table?
Two households can earn similar incomes and have very different amounts left after paying the bills. Beyond this point, we explore how a new lease, a mortgage renewal and national averages can hide the pressures behind an encouraging headline.
We’ll also look at what could turn economic growth into lasting relief, and four questions that help us judge whether households are actually getting ahead. Subscribe for free to The Sanity Project to keep reading and get beyond the headline.

Try being a senior living on a pension upon which you thought you had planned carefully and wisely for retirement, after working and contributing for over 5 decades, now pinching nickels like you once pinched pennies back when raising your own family. Did not foresee this rainy day!
And now also seeing your grown children struggle to make ends meet and being unable to help, even as your parents were once able to help you when times were tough. Also being concerned for how your grandchildren are going to thrive and get through this, whilst seeing your hope to provide a legacy to them get consumed and shrink as well. ❤️🇨🇦